Annual report design for research that deserves to be read.
Most reports are built from months of research, then designed in a rush. The findings are strong, but the publication buries them under dense pages, generic charts, and a structure nobody planned.
We design annual reports and research publications as editorial systems: clear enough to navigate, distinctive enough to remember, and built to evolve from one edition to the next.
Who this is for
For organisations publishing research, data, and ideas that need to land with senior readers.
You might be producing an annual report, a flagship research study, or a recurring thought leadership publication. The content is substantial, often dozens of pages of findings, and the people reading it are busy. If the design does not guide them, the findings do not get read.
We work with marketing, insight, and communications teams who want a report that reflects the quality of the thinking inside it, and a partner who can carry it from raw research to finished print and digital editions.
What we do
We turn complex research into publications people can navigate, understand, and remember.
A report cannot rely on a few dramatic chapter openers. The real work happens across the quieter pages: comparisons, survey results, maps, and long-form argument. We build the system that holds all of it together.
Editorial and report design
Page architecture, typography, and pacing for long-form research.
Information hierarchy
Structuring findings so readers can scan, dip in, or read end to end.
Data visualisation
Charts and infographics designed as part of the visual language, not added at the end.
Art direction and imagery
A visual idea for each edition, from photography to generative and particle-based imagery.
Print production
Large-format proofs and bound copies, so the printed edition holds up at its final scale.
Digital editions
Reports prepared for screen, download, and presentation, as well as print.
Selected project proof
Recent report design work.
A selection of recent work from the studio.
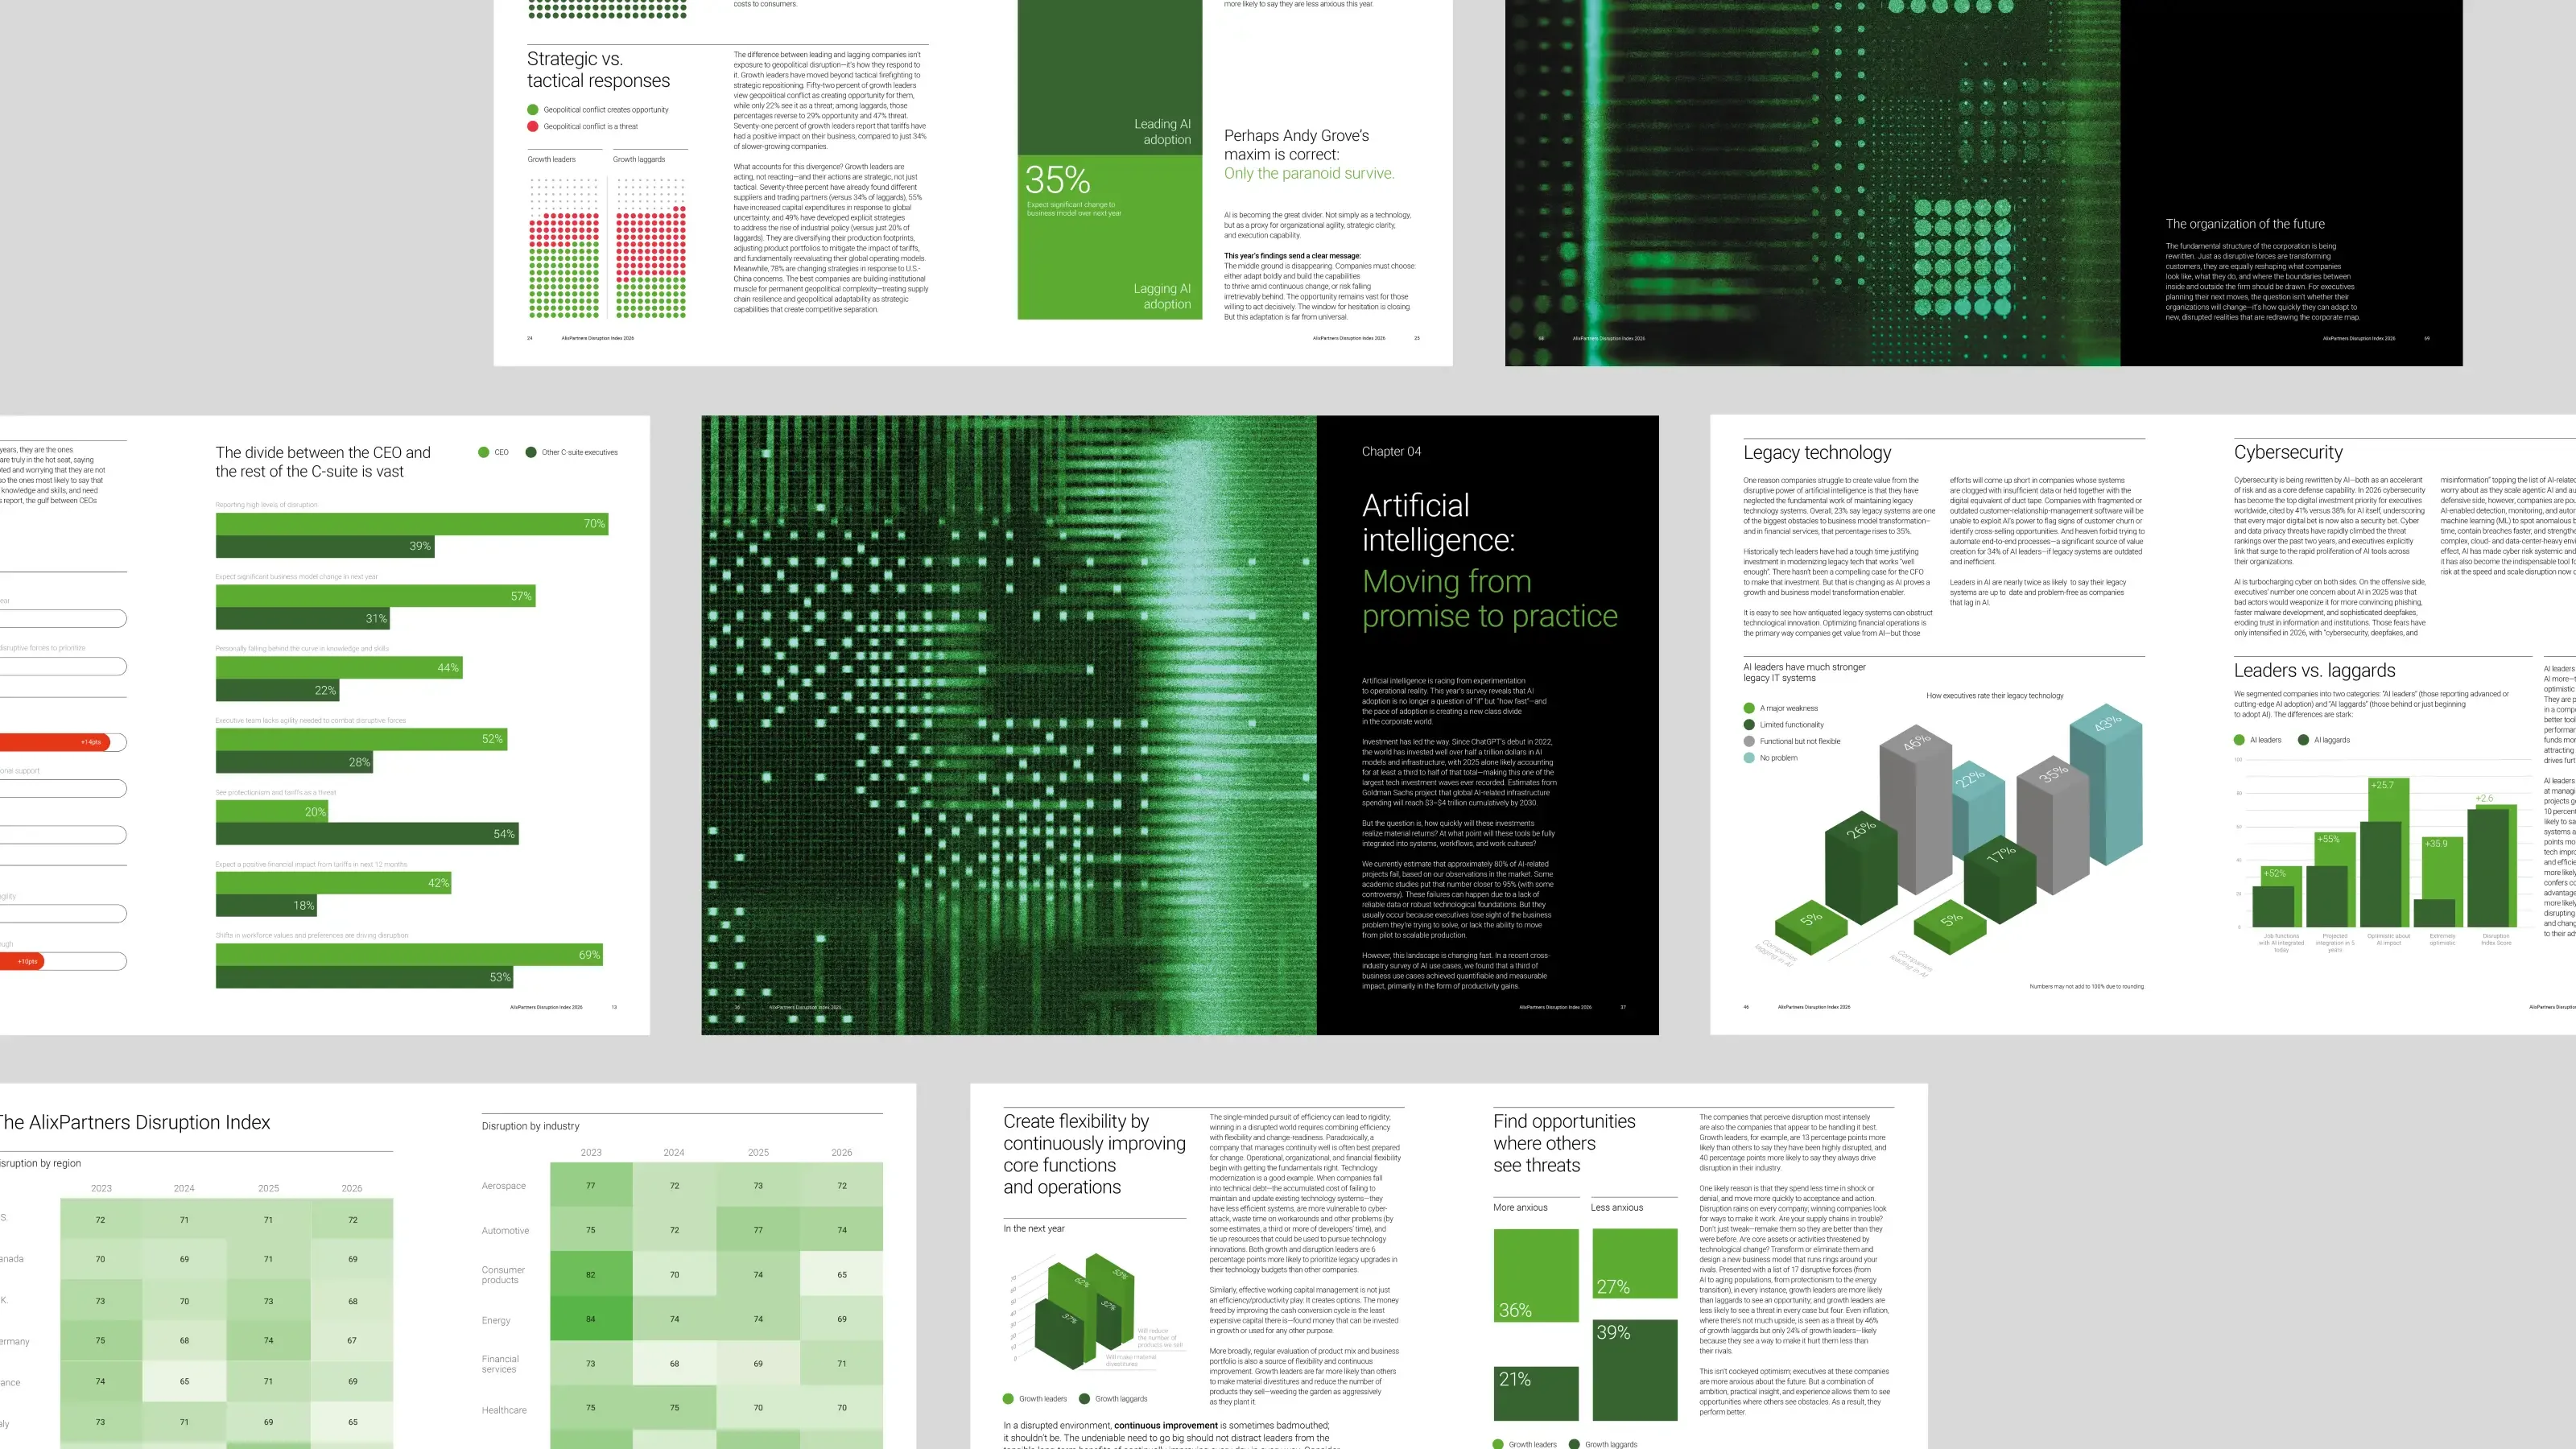
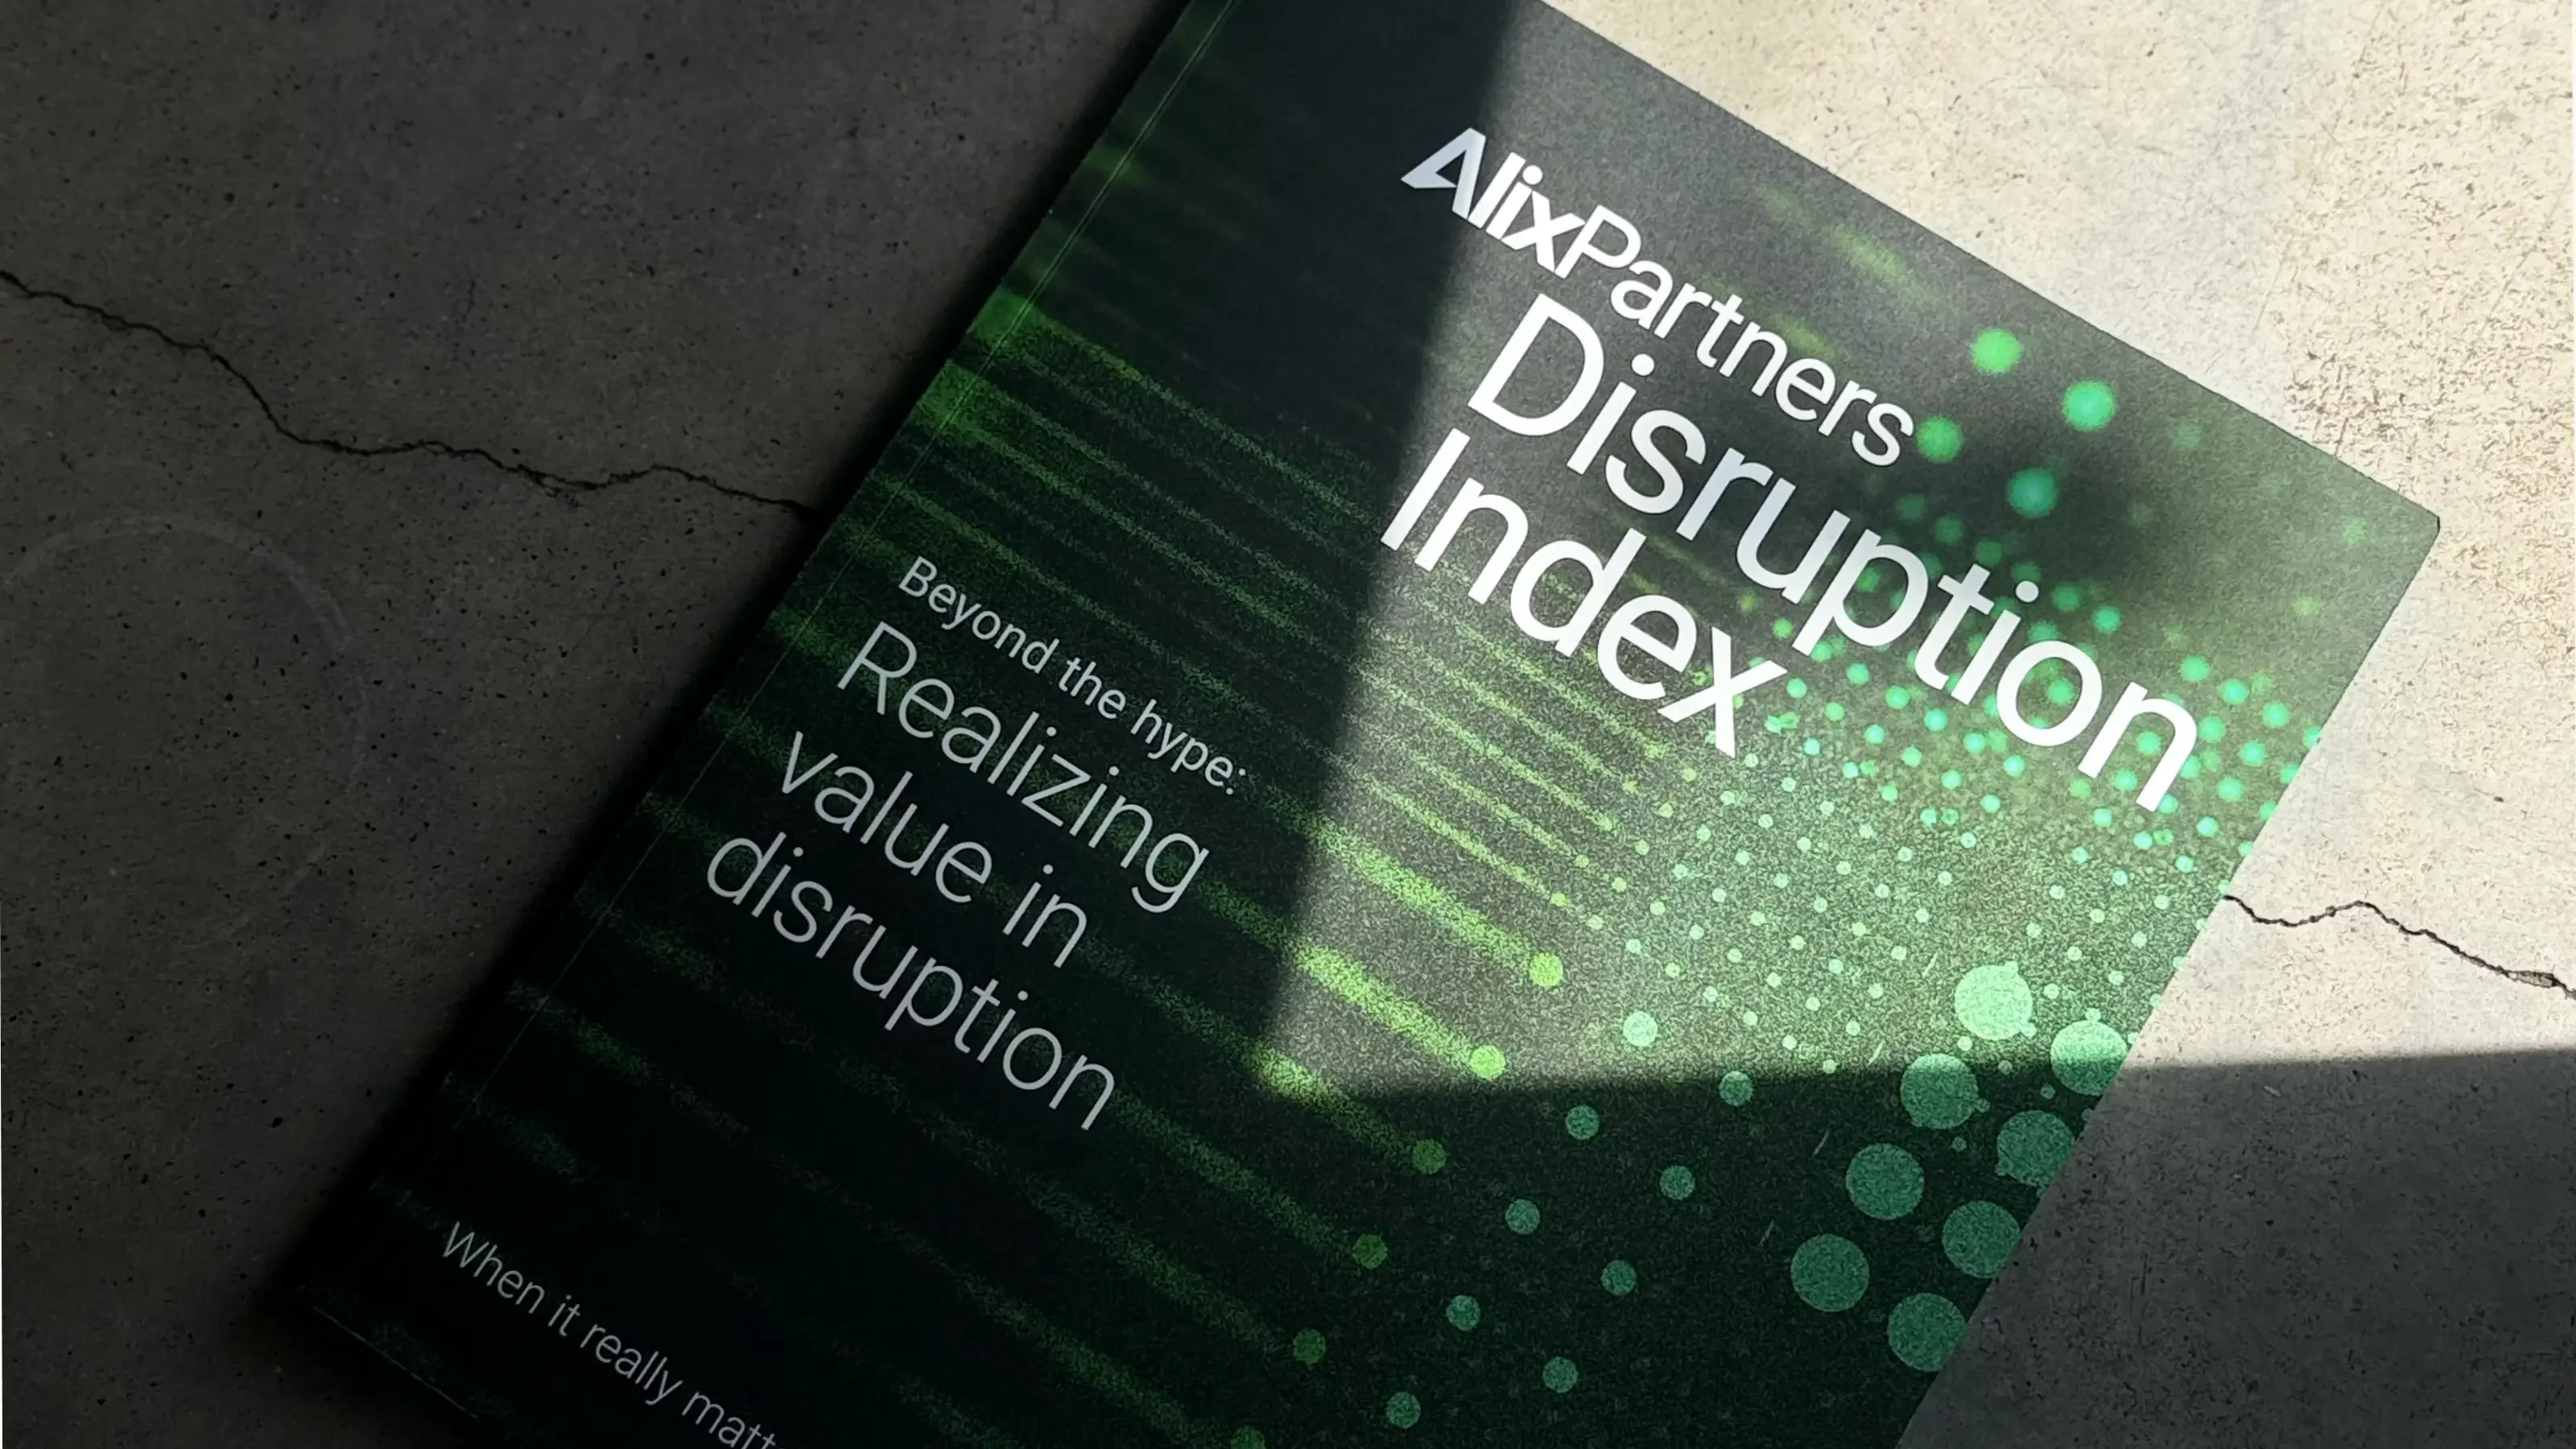
AlixPartners Disruption Index
A flagship annual research report, designed with AlixPartners over several years. The 2026 edition drew on more than 3,200 senior executives across 11 countries.
Read the project story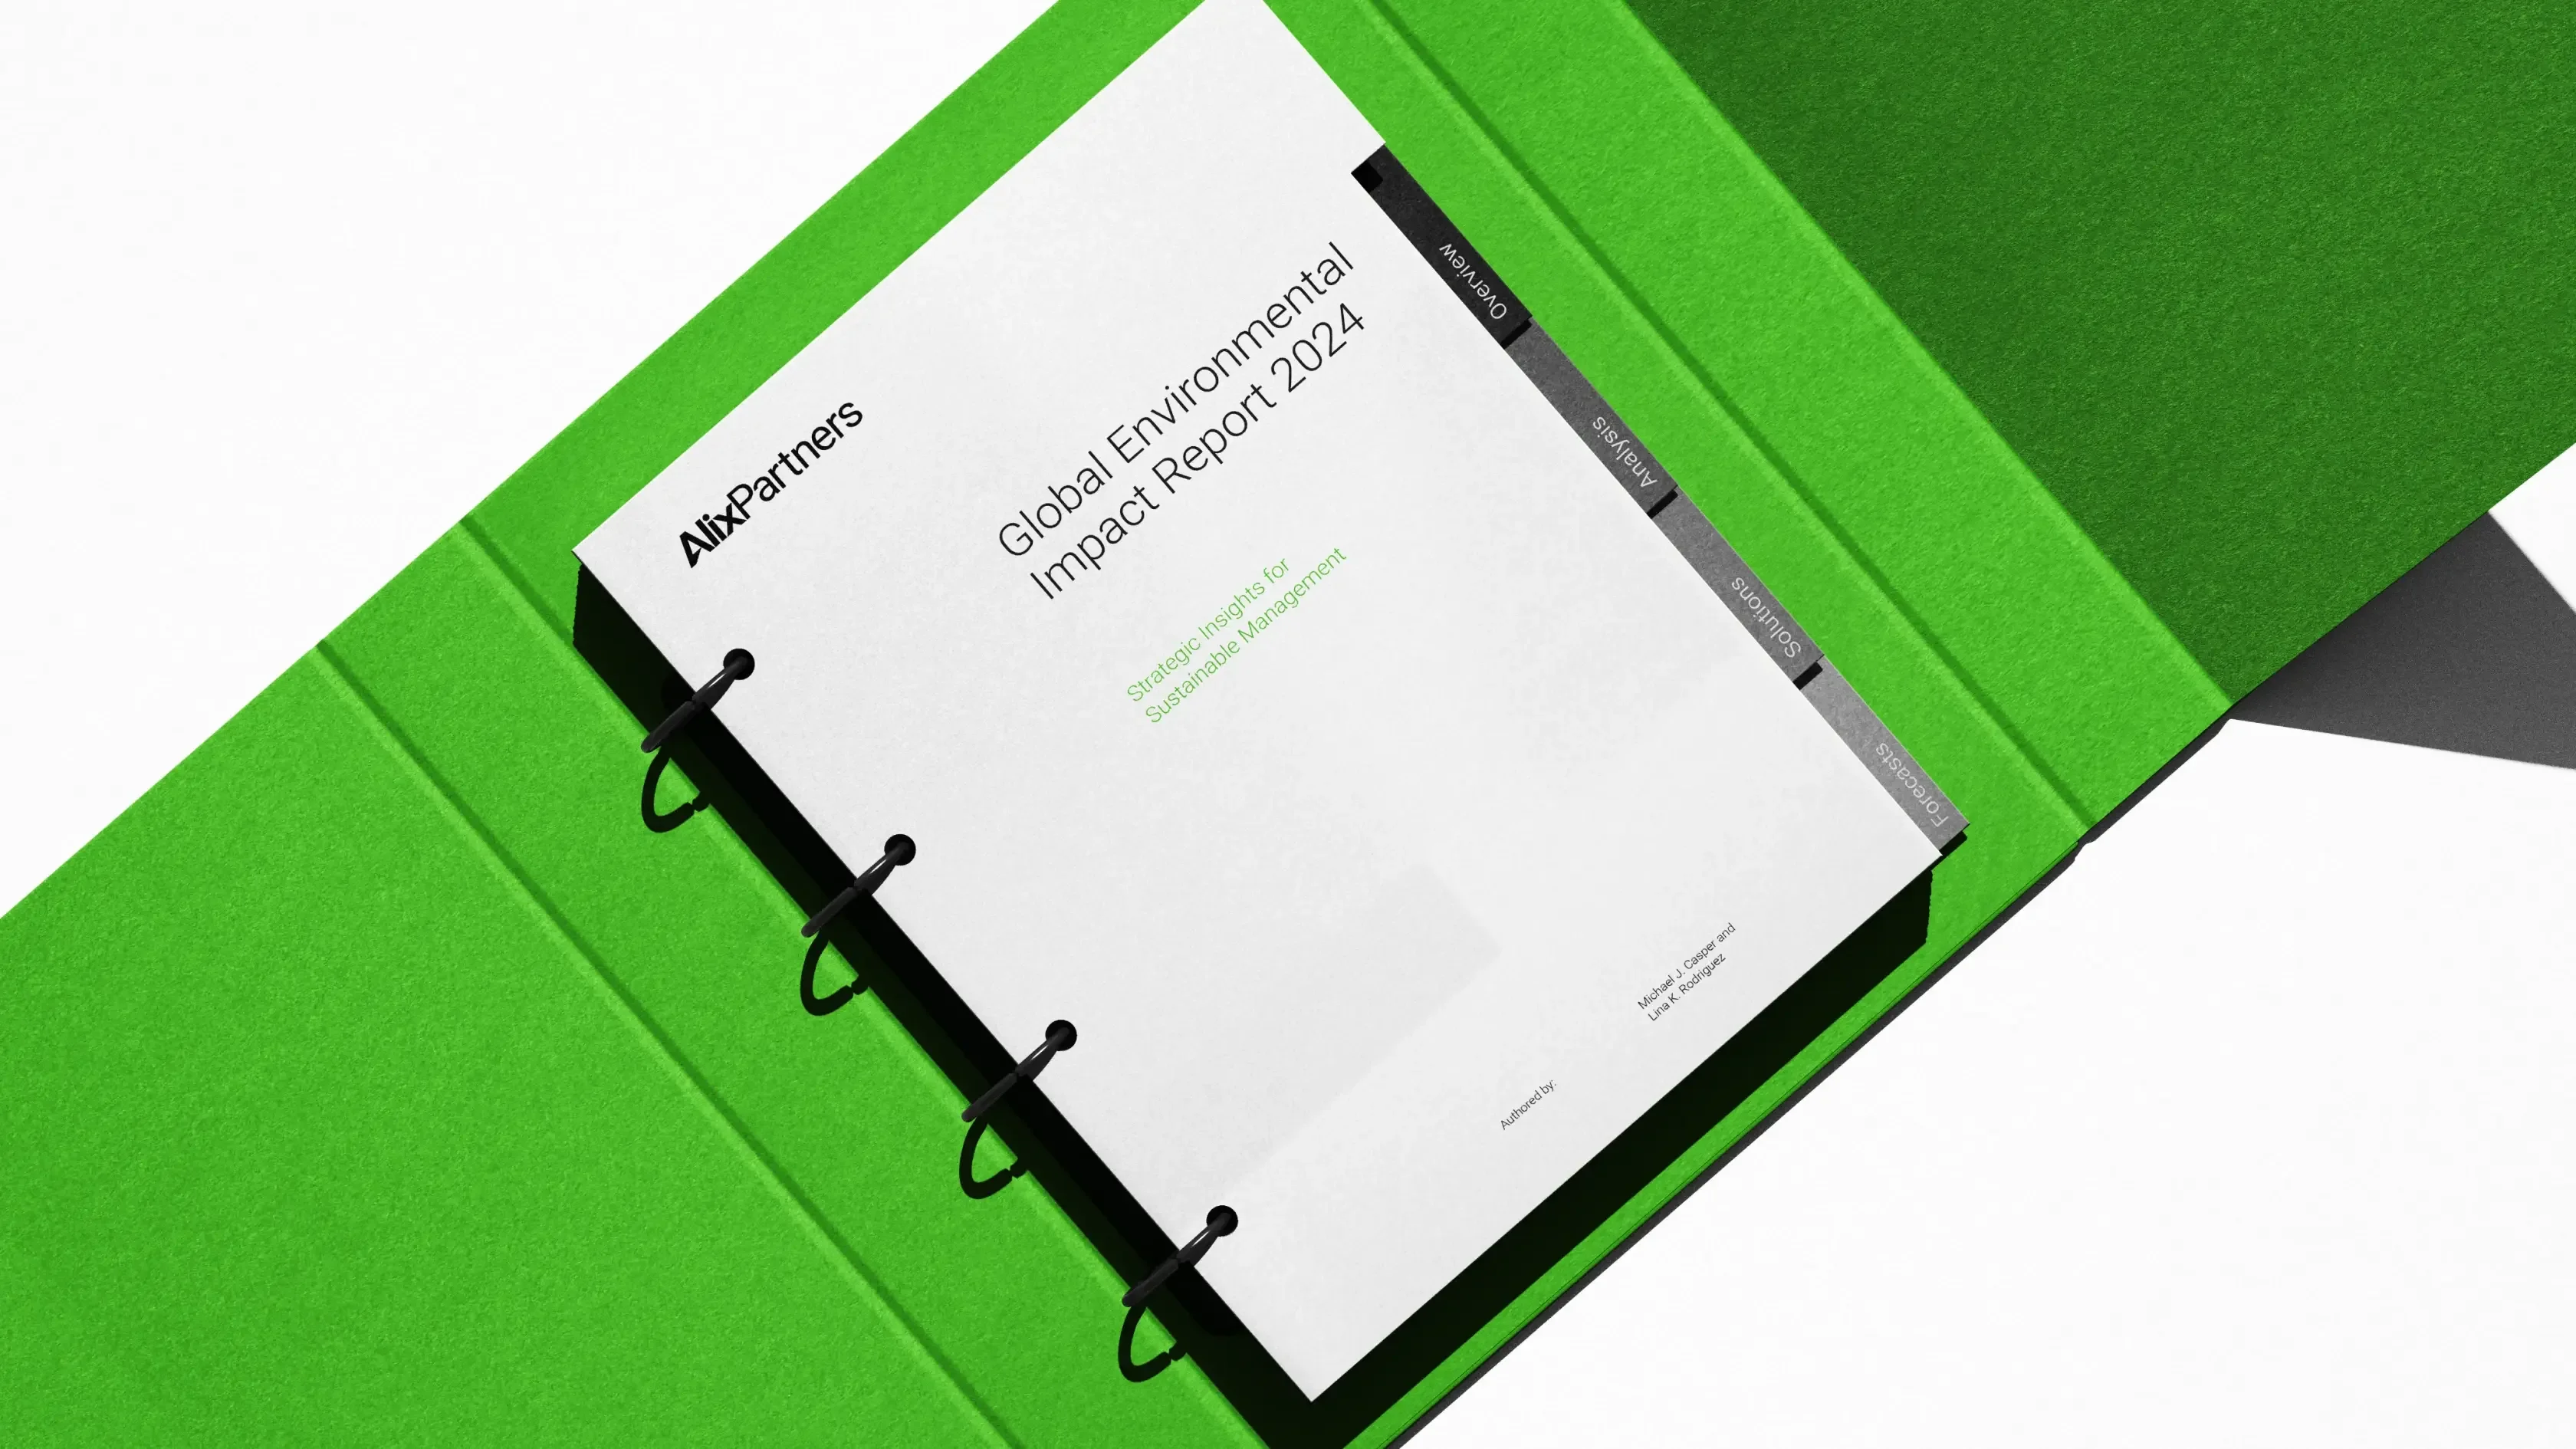
AlixPartners
The wider brand system the Disruption Index sits within, from report and folder design to a generative brand tool.
View case studyHow we work
A process built around the research, and the edition after this one.
- 01
Discovery
We get into the research early, to understand the story, the audience, and what each finding needs to do.
- 02
Visual idea
We develop a visual language for this edition, while keeping what makes the series recognisable.
- 03
Editorial system
We design the page architecture, chart styles, and chapter structures that carry the full report.
- 04
Production
We proof at final scale and prepare the print and digital editions, so the report works wherever it is read.
Common questions
Annual report design: common questions
- What kinds of reports do you design?
- Annual reports, flagship research studies, and recurring thought leadership publications. Our longest-running report project is the AlixPartners Disruption Index, a global executive survey published each year.
- Can you design for both print and digital?
- Yes. We design the report as one system, then prepare it for print, PDF download, and presentation. Print exposes decisions that are easy to miss on screen, so we proof at final scale.
- Can you evolve an existing report series?
- Yes. For recurring reports we keep the foundations that make the series recognisable and introduce a new visual idea for each edition, so it never feels like last year with the numbers swapped.
- Do you design the charts and data visualisation?
- Yes. We design charts and infographics as part of the report, working from your data so every graphic is accurate as well as distinctive.
- Can you work within our existing brand guidelines?
- Yes. Most report work sits inside an established brand, and we extend it with an editorial layer rather than replacing it. Where the brand itself needs more structure, that becomes brand system work.
If you have a report coming up and the research deserves better than a template, tell us what you are working with.